
School counselors · Updated 2026-11-11
School Counseling Data Graphs: How to Graph Pre and Post, Achievement and Attendance Results for ASCA Data Reports and RAMP (Examples, Free Printable)
Ready-made printable: Complete Small Group Counseling Bundle Holiday 20% off: about $29.44, was $37 (EUR 32) · instant digital download
Buy on Etsy
Every fifth edition ASCA data report ends with the same instruction in red: "Insert graph." It looks like the easy part. You have the numbers, you open a spreadsheet, you click a chart button. Yet graphs are where a lot of careful work quietly loses credit, because a graph that is nearly right is still wrong: a subtitle that says nothing, a Likert axis with no scale, a bar with no number on it, a percent that does not match the organizer, or a graph of individual students when ASCA asks for aggregate data.
Graphs also carry more weight than they seem to. By our count, 10 of the 82 items in the RAMP Scoring Rubric, Fifth Edition are about the graphs themselves, and another 12 are about the organizer numbers the graphs must match. That is 22 of 82 points riding on the last two pages of three templates.
This guide explains exactly what ASCA asks for, using only ASCA's own current documents: the guideline boxes printed on the fifth edition template examples, the annotated sample graph in ASCA's Graph Development Tips (Rev. 9/25), the RAMP rubric items for Sections 2, 5 and 6, and the three filled examples. It covers the four kinds of graph (Likert, knowledge, achievement and contributing factors), how to calculate every number behind them, how to write a subtitle and axis labels that pass, step by step directions for Excel, Google Sheets, PowerPoint and Canva, a full worked example with eight graphs for one fictional school year, scenarios, mistakes, details in ASCA's own examples you should not copy, and a plain list of what ASCA's documents do not say.
At the end is a free three page printable: a graph planner for all four graph types, the same planner filled in with finished graphs for a fictional achievement gap plan, and a math and check sheet keyed to the RAMP item numbers.
Jump to the free graph planner, filled example and check sheet
This is educational information for school counselors, not official ASCA guidance. ASCA National Model and RAMP are registered trademarks of the American School Counselor Association, and Lotus & Tulip is not affiliated with or endorsed by ASCA. Everything on this page was checked against ASCA's own public documents and pages, downloaded from schoolcounselor.org on November 11, 2026: Graph Development Tips (fifth edition, 6 pages, footer "Rev. 9/25"), the Templates and Resources page, the fifth edition templates download (Achievement Gap Plan, Lesson Plan and Small-Group Plan templates, footers 8/25), the "All Fifth Edition Template Examples" download (achievement gap plan, lesson plan and small-group plan examples), the RAMP Scoring Rubric, Fifth Edition (9 pages) and, for comparison only, the RAMP Scoring Rubric, Fourth Edition. Quotes are exact; where ASCA's wording contains a typo we say so rather than repeat it. Anything we could not confirm is marked as such.
The short answer
- Which graphs: the Achievement Gap Plan and the Small-Group Plan each need a life-readiness graph (ASCA Student Standards pre and post results) and an academic success graph (baseline and final achievement data), plus optional contributing-factors graphs such as attendance and discipline. The Lesson Plan needs the life-readiness graph only.
- What every graph is: a bar chart, with pre and post (or baseline and final) side by side, showing aggregate data, not individual students, and matching the numbers in the optional data organizer, which RAMP requires.
- What every graph has: a primary title (already printed on the template), a subtitle "with specific details about the students or data represented," a Y-axis label (that defines the scale if it is a Likert graph), an X-axis label, and a data point on every bar.
- The numbers: the average response for each Likert item, the percent correct for each knowledge item, and for achievement data the baseline, actual final and percent change.
- Two graphs, not one: all three ASCA examples put Likert items and knowledge items on separate graphs, because a 1 to 4 average and a 0 to 100 percent cannot share an axis.
- Tools: ASCA's Graph Development Tips give directions for Excel, Google Sheets, PowerPoint and Canva. Any of them works; the graph is pasted into the template and the template is uploaded as a PDF.
- What ASCA does not specify: colors, fonts, decimal places, axis ranges, how many items can go on one graph, and a formula or rounding rule for percent change (see the last section).
Where graphs are required
In the fifth edition there are no stand-alone graph uploads. The graphs live inside three templates, on pages headed "Graphs," and the whole template is uploaded as a PDF. The blank templates say what goes where:
| Template | Graph boxes on the blank template | RAMP section and graph items |
|---|---|---|
| Achievement Gap Plan and Data Report | "Insert graph for data from the ASCA Student Standards pre- and post-assessment results for this plan." "Insert graph for data reported in the baseline and final achievement data results for this plan." "Contributing-Factors Results Graphs (if applicable): When appropriate, insert graph(s) of baseline and final data such as attendance and discipline." | Section 2 (26 points): life-readiness graph items 2.15 to 2.18, academic success graph items 2.19 to 2.21, organizer items 2.22 to 2.26 |
| Lesson Plan and Data Report | "Insert graph for data from the ASCA Student Standards pre- and post-assessment results for this plan." No achievement graph box and no contributing-factors graph box. | Section 5 (11 points): graph item 5.8, organizer items 5.9 and 5.10 |
| Small-Group Plan and Data Report | "Insert graph(s) for data from the ASCA Student Standards pre- and post-assessment results for this plan." "Insert graph for data reported in the baseline and final achievement data results for this plan." Contributing-factors graphs "When appropriate." | Section 6 (16 points): graph items 6.10 and 6.11, organizer items 6.12 to 6.16 |
Two details are easy to miss. First, the lesson plan template has no achievement graph at all, and RAMP Section 5 has no achievement item; its organizer does have optional attendance and discipline boxes "(when applicable)." Second, the rubric is far more detailed for the gap plan than for the other two. Items 2.18 and 2.21 list every label a gap plan graph needs. Items 5.8, 6.10 and 6.11 only say the graph "accurately reflects" the data. ASCA's own examples, though, print the same five labeling guidelines on all three data reports, so build every graph to the gap plan standard and you cannot go wrong.
The rubric items, word for word
For the gap plan's life-readiness graph(s):
- 2.15 "Matches ASCA Student Standards data reported in the optional data organizer section (note: the optional data organizer section in the template is required for RAMP®)."
- 2.16 "Behavior standards addressed are identified and match standards in the plan."
- 2.17 "Pre-/post-data is represented side by side and accurately depicts aggregate data, not individual student data."
- 2.18 "Graph includes: Subtitle which adds specific details about the students or data represented on the graph. Y-axis label: describes data being graphed; if Likert-scale used, defines the scale. X-axis label: defines what is being compared. Data point included for each bar on graph."
For the gap plan's academic success graph:
- 2.19 "Matches achievement data reported in the optional data organizer section."
- 2.20 "Baseline and final data are represented side by side and accurately depict aggregate data, not individual student data."
- 2.21 "Graph includes: Subtitle - adds specific details about the students or data represented on graph. Y-axis label: describes data being graphed. X-axis label: defines what is being compared and when data is collected. Data point included for each bar on graph."
For the lesson plan: 5.8 "Uploaded template includes life-readiness graph(s) that accurately reflects the ASCA Student Standards data." For the small group: 6.10 the same wording, and 6.11 "Uploaded template includes academic success graph that accurately reflects the achievement data."
The organizer items behind the graphs: 2.22, 5.9 and 6.12 "Data calculates average student responses for Likert items or percent correct for knowledge-based items"; 2.23, 5.10 and 6.13 "Results provided for each assessment item in plan"; 2.24 and 6.14, achievement data matches the baseline in the goal or small group; 2.25 and 6.15, actual final achievement data reported (2.25 adds "may be different from projected final data"); 2.26 and 6.16 "Percent change from baseline to final data reported."
Notice what is not in the list: no rubric item mentions attendance or discipline graphs. We searched the fifth edition rubric for both words and found them nowhere. Contributing-factors graphs are optional on the templates and, as far as we can tell, not scored. They can still strengthen the story you tell your principal and advisory council.
ASCA's five graph guidelines
The blank templates only say "Insert graph." The rules are printed in red on ASCA's filled examples, above each graph box, and they are identical across the gap plan, lesson plan and small-group examples. For ASCA Student Standards results:
"Follow these guidelines for graphs. Pre-/post-assessment results: 1. Match data reported in the results section. 2. Data represented side by side. 3. Graph aggregate data, not individual student data. All graphs are bar charts and include: 1. Primary title: ASCA Student Standards Data Results 2. Subtitle with specific details about the students or data represented on graph 3. Y-axis label: describes data being graphed; if Likert scale is used, defines the scale 4. X-axis label: defines what is being compared 5. Data points included for each bar on graph"
For achievement results, the box changes in three places: "1. Primary title: Achievement Data Results," "3. Y-axis label: describes data being graphed" (no scale), and "4. X-axis label: defines what is being compared and when data was collected."
So every graph has eight ingredients: a bar chart, side by side bars, aggregate data, numbers that match the organizer, a subtitle, a Y-axis label, an X-axis label and data points. The primary title is the one ingredient you do not type into your chart, which leads to the most useful sentence in ASCA's Graph Development Tips.
Anatomy of an ASCA graph
Page 2 of Graph Development Tips, titled "Graph Definitions," is a single annotated bar chart. Its callouts name every part ASCA cares about, and it is the clearest picture of a passing graph that ASCA publishes. Here is what it shows:
| Part (ASCA's callout) | What the sample shows |
|---|---|
| Subtitle* | 7th Grade "Get Organized" Small Group, centered above the bars, in the spot your software calls the chart title |
| Y-axis label, with "Include scale range for Likert" | Average Likert Scale Response (1=Strongly Disagree - 4=Strongly Agree), running up the left side; the axis itself runs from 0 to 4 in steps of 0.5 |
| Chart label | The full item statement under each pair of bars: "1. I know how to manage my time to complete all of the things I want to do." "2. I have the ability to organize my school materials." "3. I have adults that I can reach out to when I need help." |
| X-axis label | Comparison of Results |
| Data point | A number on every bar: 2.7 and 3, 3.07 and 3.15, 2.9 and 3.33 |
| "Impact at a glance with side-by-side comparison" | Pre and post bars next to each other for each item, with a Pre and Post legend underneath |
The asterisk on "Subtitle" leads to this footnote: "*Primary Title and ASCA Student Standards are provided on the ASCA National Model fifth edition templates." That settles a question many counselors get wrong. The words "ASCA Student Standards Data Results" or "Achievement Data Results" are already printed on the template above the graph box, so the title you type into Excel's "Chart Title" box is ASCA's subtitle. Do not repeat the primary title inside the chart and leave the subtitle out. Type the specific details there.
Two smaller lessons from the sample. Its data points mix decimal places (3, 3.07, 3.33), which is simply what Excel shows by default; ASCA sets no decimal rule, and one consistent format is easier to read. And in the sample and in all three filled examples, the scale label reads "1=Strongrly Disagree." That is a typo in ASCA's graphics. Copy the idea, not the spelling.
The four kinds of graph
1. Life-readiness graph: Likert items
A Likert item is a statement students rate, such as "I keep reading even when the words get hard," on a scale. Every fifth edition ASCA example uses a four point agree scale, 1 = Strongly Disagree to 4 = Strongly Agree. The organizer asks you to "Calculate the average student response for each Likert-scale item," so the bar height is an average, not a count and not a percent.
The number: add every student's rating for the item and divide by the number of students who answered it. Seven students rating an item 2, 2, 1, 3, 2, 2 and 2 give a total of 14, and 14 / 7 = 2.0.
The graph: one pair of bars per Likert item, pre and post side by side, the item statement (or a faithful short version) as the category label under each pair, a Y-axis that runs from 0 to the top of your scale, and a Y-axis label that names the scale: "Average Likert Scale Response (1 = Strongly Disagree, 4 = Strongly Agree)." In ASCA's examples the Likert axis always runs from 0 to 4, never automatically to 3.5 or 5. Set it yourself, because spreadsheet software picks its own maximum and a bar at 3.8 on a 0 to 4 axis looks very different from the same bar on a 0 to 5 axis.
From ASCA's examples: the gap plan example graphs two Likert statements ("I have a specific goal with a plan to achieve it." 2.4 to 3, and "I recognize when I am off track and correct it." 1.4 to 4). The lesson plan example graphs one ("I see how my wants and the wants of others interact." 2.1 to 3.2). The small-group example graphs one ("I pay attention and take notes in class." 2.2 to 3.8). One item on a graph is fine.
2. Life-readiness graph: knowledge items
A knowledge item has a right answer, such as "List two things you can do when you get stuck on a word." The organizer asks for "percent correct for each knowledge-based item."
The number: students who answered correctly divided by students who answered, times 100. Four correct out of 14 is 4 / 14 x 100 = 28.6 percent.
The graph: one pair of bars per knowledge item, a Y-axis from 0 to 100, and a Y-axis label such as "Percent Correct" (the gap plan and lesson plan examples) or "Percent of Students Who Answered Correctly" (the small-group example; ASCA's graphic spells it "Answerd"). The second label is the clearer of the two, because it tells the reader what 86 means.
From ASCA's examples: the gap plan example's knowledge graph shows "List 3 tools you can use to improve your attendance." 28 to 75 and "Describe what makes it hard for you to learn math." 35 to 90. The small-group example graphs five knowledge items on one chart, including one where nobody answered correctly before the group (0 to 50).
3. Academic success graph: achievement data
This graph compares baseline and final achievement data for the same students: F grades, course failures, benchmark or test results, grades or GPA, credits, or whatever achievement measure the plan named. It is required on the gap plan (2.19 to 2.21) and the small-group plan (6.11) and not used on the lesson plan.
The numbers: the baseline (which "matches baseline achievement data in goal statement" on the gap plan, or the baseline for the group on the small-group plan), the actual final data ("may be different from projected final data"), and the percent change, which the organizer asks for in its own box.
The graph: usually just two bars, baseline and final. The X-axis is where most graphs fall short, because ASCA's achievement guideline asks the X-axis label to define "what is being compared and when data was collected." The gap plan example handles it with category labels "First Quarter" and "Fourth Quarter" and the axis title "F's Before and After Interventions," under a Y-axis label "Number of F Grades in Math for Identified Students." The small-group example uses "Previous School" and "End of 1st Semester," the axis title "Results Before and After Interventions," and the Y-axis label "Number of Students with one or more F on their report card."
Adjusted baselines: if a student leaves, both examples adjust the baseline to the students still in the plan and say so with an asterisk. The gap plan organizer reads "13* F grades... *Adjusted baseline due to one student withdrawing," and the small-group graph shows "2*" with the note "*One student transferred to another school." Put the asterisk on the bar or category and the note directly under the graph, so the graph is honest on its own.
4. Contributing-factors graphs: attendance and discipline
The gap plan and small-group templates both say: "When appropriate, insert graph(s) of baseline and final data such as attendance and discipline." These graphs are optional, and as noted above, no fifth edition rubric item scores them. Use them when attendance or behavior was part of the story: when the plan named chronic absence as a contributing factor, when a strategy targeted late arrivals, or when your principal will ask.
ASCA gives no separate labeling rules for these graphs. Apply the achievement guidelines: baseline and final side by side, a subtitle that names the students, a Y-axis label that names the measure ("Total absences for the 14 students"), an X-axis label that says when each number was collected, and a data point on every bar. Compare equal periods. ASCA's gap plan example reports "114* cumulative absences in the 2024 to 2025 school year" against "47 cumulative absences in the 2025 to 2026 school year," which is two full years, but if your final period is shorter than your baseline period, use a rate (absences per student, or percent of days missed) or two windows of the same length, and say which in the label. Interestingly, that example leaves its own contributing-factors graph box empty even though the organizer has attendance numbers, which confirms the graph is optional.
The numbers behind the graphs
Do the arithmetic before you open any charting tool, in the organizer order, and graph from that table. A graph that "Matches ASCA Student Standards data reported in the optional data organizer section" (2.15) is easiest when the graph is built from the very cells you typed into the organizer.
Likert average
Average = sum of all ratings for the item / number of students who rated it. Report one or two decimals, and use the same number of decimals on the organizer and the graph. If the organizer says 1.9, the bar should say 1.9, not 1.86.
Percent correct
Percent correct = students who answered correctly / students who answered x 100. Decide your answer key before you score the pre-assessment, and write it down. ASCA's documents do not say how to score partial answers (one of two strategies named, for example); we found no rule, so set yours ("correct only with two acceptable answers") and apply it the same way to pre and post.
Which students count
ASCA does not say whether pre and post results must come from exactly the same students. The examples, however, report beginning and end participation and explain changes ("One student withdrew to another state"), and the rubric asks for an explanation "if number of students changes from beginning to end of plan" (2.14, 5.7). The cleanest practice is to graph matched data: only students who completed both the pre and the post, with that number in the subtitle. Then a student who left after session three cannot drag the pre average down or vanish from the post.
Percent change
The organizer has a box for "Percent Change from Baseline to Final Data." ASCA does not print a formula. The standard one, and the one that reproduces ASCA's example numbers, is: percent change = (final minus baseline) / baseline x 100. A negative result is a decrease. Name the direction in words ("a 38.5 percent decrease in F grades"), because "-38.5%" alone confuses readers who are not sure whether fewer is better.
Two things in ASCA's examples are worth knowing. The gap plan example goes from 13 F grades to 8 and reports "38.4%." The exact figure is 38.46 percent, which rounds to 38.5; the example appears to cut off the last digit rather than round. And the small-group example goes from "Five of nine students had a cumulative GPA of 3.0 or higher" to "Six of eight students" and reports a "20% increase," which is the change in the count (5 to 6). The change in the share of students is larger (55.6 percent to 75.0 percent of the group). Either is defensible if you say which one you used; ASCA gives no rule. Our suggestion: use counts when the group stayed the same size and the baseline was adjusted, and say "count" or "share" in the label.
A layout that makes graphing fast
Set up one sheet per data report with the items as rows and pre and post as columns. The item text goes in the first column, because Excel and Google Sheets use it as the category label automatically:
| Item (short form) | Pre | Post |
|---|---|---|
| 1. I set a goal for my reading each week. | 1.8 | 3.1 |
| 3. I keep reading even when the words get hard. | 2.0 | 3.2 |
Make a second block for the knowledge items (percent), a third for achievement (baseline and final, with the period in the header, "First trimester, Dec 2028" and "Third trimester, June 2029"), and a fourth for any contributing-factors data. One block, one graph.
Writing the subtitle
ASCA's subtitle must give "specific details about the students or data represented on graph." The examples show the minimum: grade, group and program name ("Seventh-Grade Students with F in Math," "Eighth-Grade 'Stop Mean Behaviors' Lesson," "New Student Support Group"). A stronger subtitle answers four questions in one line: who, how many, what, and when.
A formula that works: [plan or lesson name], [grade or group], [number of students who completed pre and post], [month and year].
| Weak subtitle | Why it falls short | Stronger subtitle |
|---|---|---|
| ASCA Student Standards Data Results | That is the primary title, already on the template | Reading Strong gap plan, grade 4, 14 students who completed pre and post, Jan to May 2029 |
| Pre/Post Results | No students, no program, no date | Plan It, Pack It lesson, all grade 4, 71 students who completed pre and post, Oct 2028 |
| Group Data | Which group, which data? | Cool and Ready group, grade 5, 7 students who completed pre and post |
| Grades | Which grades, for whom, when? | Reading Strong gap plan, grade 4 students with a 1 in reading, 2028 to 2029 |
| Mrs. Lopez's Class | Identifies a class rather than describing students, and a single class can make individual students easy to guess | Grade 2 conflict resolution lesson, 3 classes, 66 students |
Keep student names, initials and ID numbers out of every subtitle, label and note. The rubric's opening page is explicit: "No identifiable student information should be included."
Writing the axis labels
The axis labels are where graphs most often miss rubric credit, because the default chart in every program has no axis titles at all. You have to add them.
| Label | ASCA's rule | Weak | Strong |
|---|---|---|---|
| Likert Y-axis | "describes data being graphed; if Likert scale is used, defines the scale" | Score | Average Likert Scale Response (1 = Strongly Disagree, 4 = Strongly Agree) |
| Knowledge Y-axis | "describes data being graphed" | Percent | Percent of Students Who Answered Correctly |
| Achievement Y-axis | "describes data being graphed" | Number | Number of 1s in reading for the students in the plan |
| Life-readiness X-axis | "defines what is being compared" | (none) | Comparison of Results (pre and post, by item), with the item statements as category labels |
| Achievement X-axis | "defines what is being compared and when data was collected" | Before / After | Categories "First trimester report card (Dec 2028)" and "Third trimester report card (June 2029)"; axis title "1s in reading before and after the plan" |
"Comparison of Results," the X-axis title in every ASCA example and in the annotated sample, is safe to reuse. The item statements under the bars are the "chart labels" in ASCA's sample, and they do most of the work of defining what is being compared. Use the full statement if it fits; if you shorten it, keep the item number so a reviewer can match it to the organizer ("1. I set a goal for my reading each week.").
How to build the graph in Excel, Google Sheets, PowerPoint or Canva
ASCA's Graph Development Tips cover four tools, each page beginning with the same note: "Refer to ASCA templates for specific directions and examples on labeling." Their steps, condensed, plus the settings ASCA does not mention but your graph needs:
Excel
ASCA's steps: select the cells with the assessment items and the pre and post headings and data; Insert; Recommended Charts; "CLUSTERED COLUMN"; click Chart Title to add a name; drag a corner to enlarge; click the chart, then Chart Design; Add Chart Element; Axis Titles; Horizontal Axis, then repeat for Vertical Axis; Data Labels, and choose where the numbers appear.
Our additions: right-click the vertical axis, choose Format Axis, and set the Bounds to Minimum 0 and Maximum 4 (Likert) or 100 (percent). Set the number format of the data labels to match the organizer, for example one decimal place for Likert averages. Put the legend at the bottom.
Google Sheets
ASCA's steps: select the cells; Insert; Chart; "COLUMN CHART"; drag a corner to enlarge. To change titles, open the chart editor, Customize, "CHART & AXIS TITLES," choose each title from the dropdown and type in the Title text box. For data points: Customize, Series, tick Data labels. The page also mentions a video walkthrough and has a workaround "To include Likert Scale Scores to the Vertical Axis": Insert, Drawing, add a text box, rotate it and drag the image into place.
Our additions: before the drawing workaround, try typing the scale straight into the vertical axis title ("Average response (1 = Strongly Disagree, 4 = Strongly Agree)"); it usually fits. Set the vertical axis Min and Max under Customize, Vertical axis.
PowerPoint
ASCA's steps: new slide, the graph icon, Column, "CLUSTERED COLUMN"; in the spreadsheet that opens, delete the Series 3 column, change the column titles to Pre and Post, and type your items (or baseline data) and results (or final data); back in PowerPoint, edit the Chart Title, then Chart Design, Add Chart Elements, Axis Titles (horizontal and vertical) and Data Labels.
Canva
ASCA's steps: search "BAR GRAPH," choose "GROUPED BAR," enter or import the data; for titles, Customize in the chart menu and fill in the X and Y axis boxes; for data points, Customize and tick Data labels.
Our addition for Canva: check that the grouped bar chart is vertical columns rather than horizontal bars. ASCA's examples are all vertical, though we found no rule against horizontal bars.
Getting the graph into the template
Copy the finished chart as a picture (or download it as a PNG) and paste it into the graph box below the instruction line. Do not delete the template's printed headings, the guideline text or the "Behavior Standards Addressed" list; the rubric warns that "Using the wrong templates or altering templates may lead to rubric not being met." After you export the template to PDF, zoom in to 200 percent and check that every data label and axis title is readable. In ASCA's own small-group example, the knowledge graph's axis numbers and Y-axis label are so small they are barely legible on a printed page.
Fourth edition versus fifth edition graphs
If you learned graphing for RAMP under the fourth edition, three things changed. The fourth edition rubric asked for separate graph uploads ("Mindsets & Behaviors data results bar graph(s)" and "Outcome data results bar graph(s)") and said: "If both Likert-scale items and knowledge-based questions are asked in the pre/post assessment, create one graph for Likert-scale results and one graph for knowledge-based results. Save both graphs in one document for upload." Each graph cluster earned one point if its descriptors were met, for example "Bar graph(s) includes title, labeled axes and data points."
In the fifth edition the graphs sit inside the templates, the life-readiness graph is no longer called a "Mindsets & Behaviors" graph, the outcome graph is now the academic success graph for achievement data, and the labeling rules are spelled out item by item for the gap plan (2.18 and 2.21). The fifth edition rubric no longer prints the "one graph for Likert-scale results and one graph for knowledge-based results" sentence, but every fifth edition example still follows it.
Small numbers, privacy and honest graphs
- Aggregate only. 2.17 and 2.20 ask for aggregate data, "not individual student data." No bar per student, ever, even in a group of four.
- Small groups move in big steps. With seven students, each correct answer is worth 14.3 percentage points. Put the number of students in the subtitle so a jump from 14 to 71 percent is read correctly.
- Show the zeros. A data point is required "for each bar on graph." If no one answered correctly before the group, the bar has no height, so add a visible "0" label. ASCA's small-group example has exactly this case and no label on the zero bar; do better than the example.
- Start the axis at zero. ASCA's examples all do. An axis that starts at 2 makes a change from 2.4 to 3.0 look like a tripling.
- Do not hide a drop. If an item went down, graph it. RAMP asks for "Results provided for each assessment item in plan," not for good results, and the reflection boxes are where you explain it.
- Do not claim cause. ASCA's small-group example says it well: "Although we cannot show causation for the academic success, students in the group reported that the group experience helped them." A graph shows change; your reflection can say what you think contributed.
What not to copy from ASCA's examples
ASCA's examples are the best model available, but they are teaching documents, and a few details would cost you on a careful read:
- The small-group example's academic success graph and organizer use different measures. The graph shows "Number of Students with one or more F on their report card," 9 then 2*. The organizer's achievement boxes report students with "a cumulative GPA of 3.0 or higher," five of nine then six of eight, with a "20% increase." The guideline says to "Match data reported in the results section," and 6.14 and 6.11 tie the graph to the organizer. Graph the same measure the organizer reports.
- The gap plan example's percent change is truncated (38.4 instead of 38.46, which rounds to 38.5).
- A zero bar without a data point in the small-group knowledge graph.
- Inconsistent subtitles: the lesson example's Likert graph says "Lesson" and its knowledge graph says "Lessons."
- Typos in the axis labels: "Strongrly" in the Likert scale label of all three examples and the annotated sample, and "Answerd" in the small-group knowledge graph.
- Mixed decimals: "3" next to "3.07" in the annotated sample, and whole numbers next to one decimal elsewhere.
None of this makes the examples less useful. It just means you should follow ASCA's written guidelines where the pictures and the rules disagree.
How to make an ASCA data report graph, step by step
- Finish the organizer first. Type the Likert averages, percents correct, baseline, final and percent change into the template's optional data organizer, which RAMP requires. The graph copies these numbers; it never introduces new ones.
- Build one table per graph. In a spreadsheet, list the Likert items with pre and post averages, then a separate block for knowledge items in percent, then achievement baseline and final with the period in each header.
- Insert a clustered column chart. Select the item names and the pre and post columns and insert a clustered column (Excel, PowerPoint), a column chart (Google Sheets) or a grouped bar (Canva), exactly as ASCA's Graph Development Tips describe.
- Type the subtitle where the software says chart title. The primary title is printed on the template. Write who, how many and when: "Reading Strong gap plan, grade 4, 14 students who completed pre and post, Jan to May 2029."
- Add both axis titles. Likert Y-axis with the scale defined, knowledge Y-axis as percent of students who answered correctly, achievement Y-axis naming the measure, and an X-axis title that says what is compared and, for achievement, when the data was collected.
- Fix the axis range. Set the vertical axis from 0 to the top of your Likert scale, or 0 to 100 for percents. Never let the axis start above zero.
- Turn on data labels for every bar. Use the same number of decimals as the organizer (one decimal works well for Likert averages), and add a visible label to any zero bar.
- Check the numbers against the organizer. Read each bar label aloud next to the organizer: same items, same order, same values, same decimals. Check that the behavior standards listed above the graph match the plan.
- Paste the chart into the template. Copy it as a picture into the right graph box, add an asterisk note for any adjusted baseline, and leave every printed heading and guideline on the template untouched.
- Export to PDF and inspect it. Zoom in, check that every label is legible and that no student is identifiable, then save the PDF for your files, your administrator and the RAMP portal.
A worked example: eight graphs at Maple Hollow Elementary, June 2029 (fictional)
Maple Hollow Elementary is a fictional public elementary school with kindergarten to grade 5 and one school counselor, J. Rivera. The principal, A. Brooks, supervises the counseling program. Readers of our other guides have followed the school's 2028 to 2029 school year, its RAMP data collection year: the "Reading Strong" achievement gap plan for grade 4 students with a 1 in reading, the "Plan It, Pack It" grade 4 classroom lesson in October 2028, and the "Cool and Ready" grade 5 test worry group in January and February 2029. Final report cards came out on Friday, June 8, 2029. On Tuesday, June 12, 2029, Rivera builds all eight graphs in one Google Sheets file, one tab per data report, straight from the organizers she has already completed. Every name, number and date is invented for illustration.
Achievement gap plan: four graphs
| Graph | Subtitle (typed as chart title) | Y-axis label and range | X-axis: categories and title | Bars (pre or baseline, post or final) |
|---|---|---|---|---|
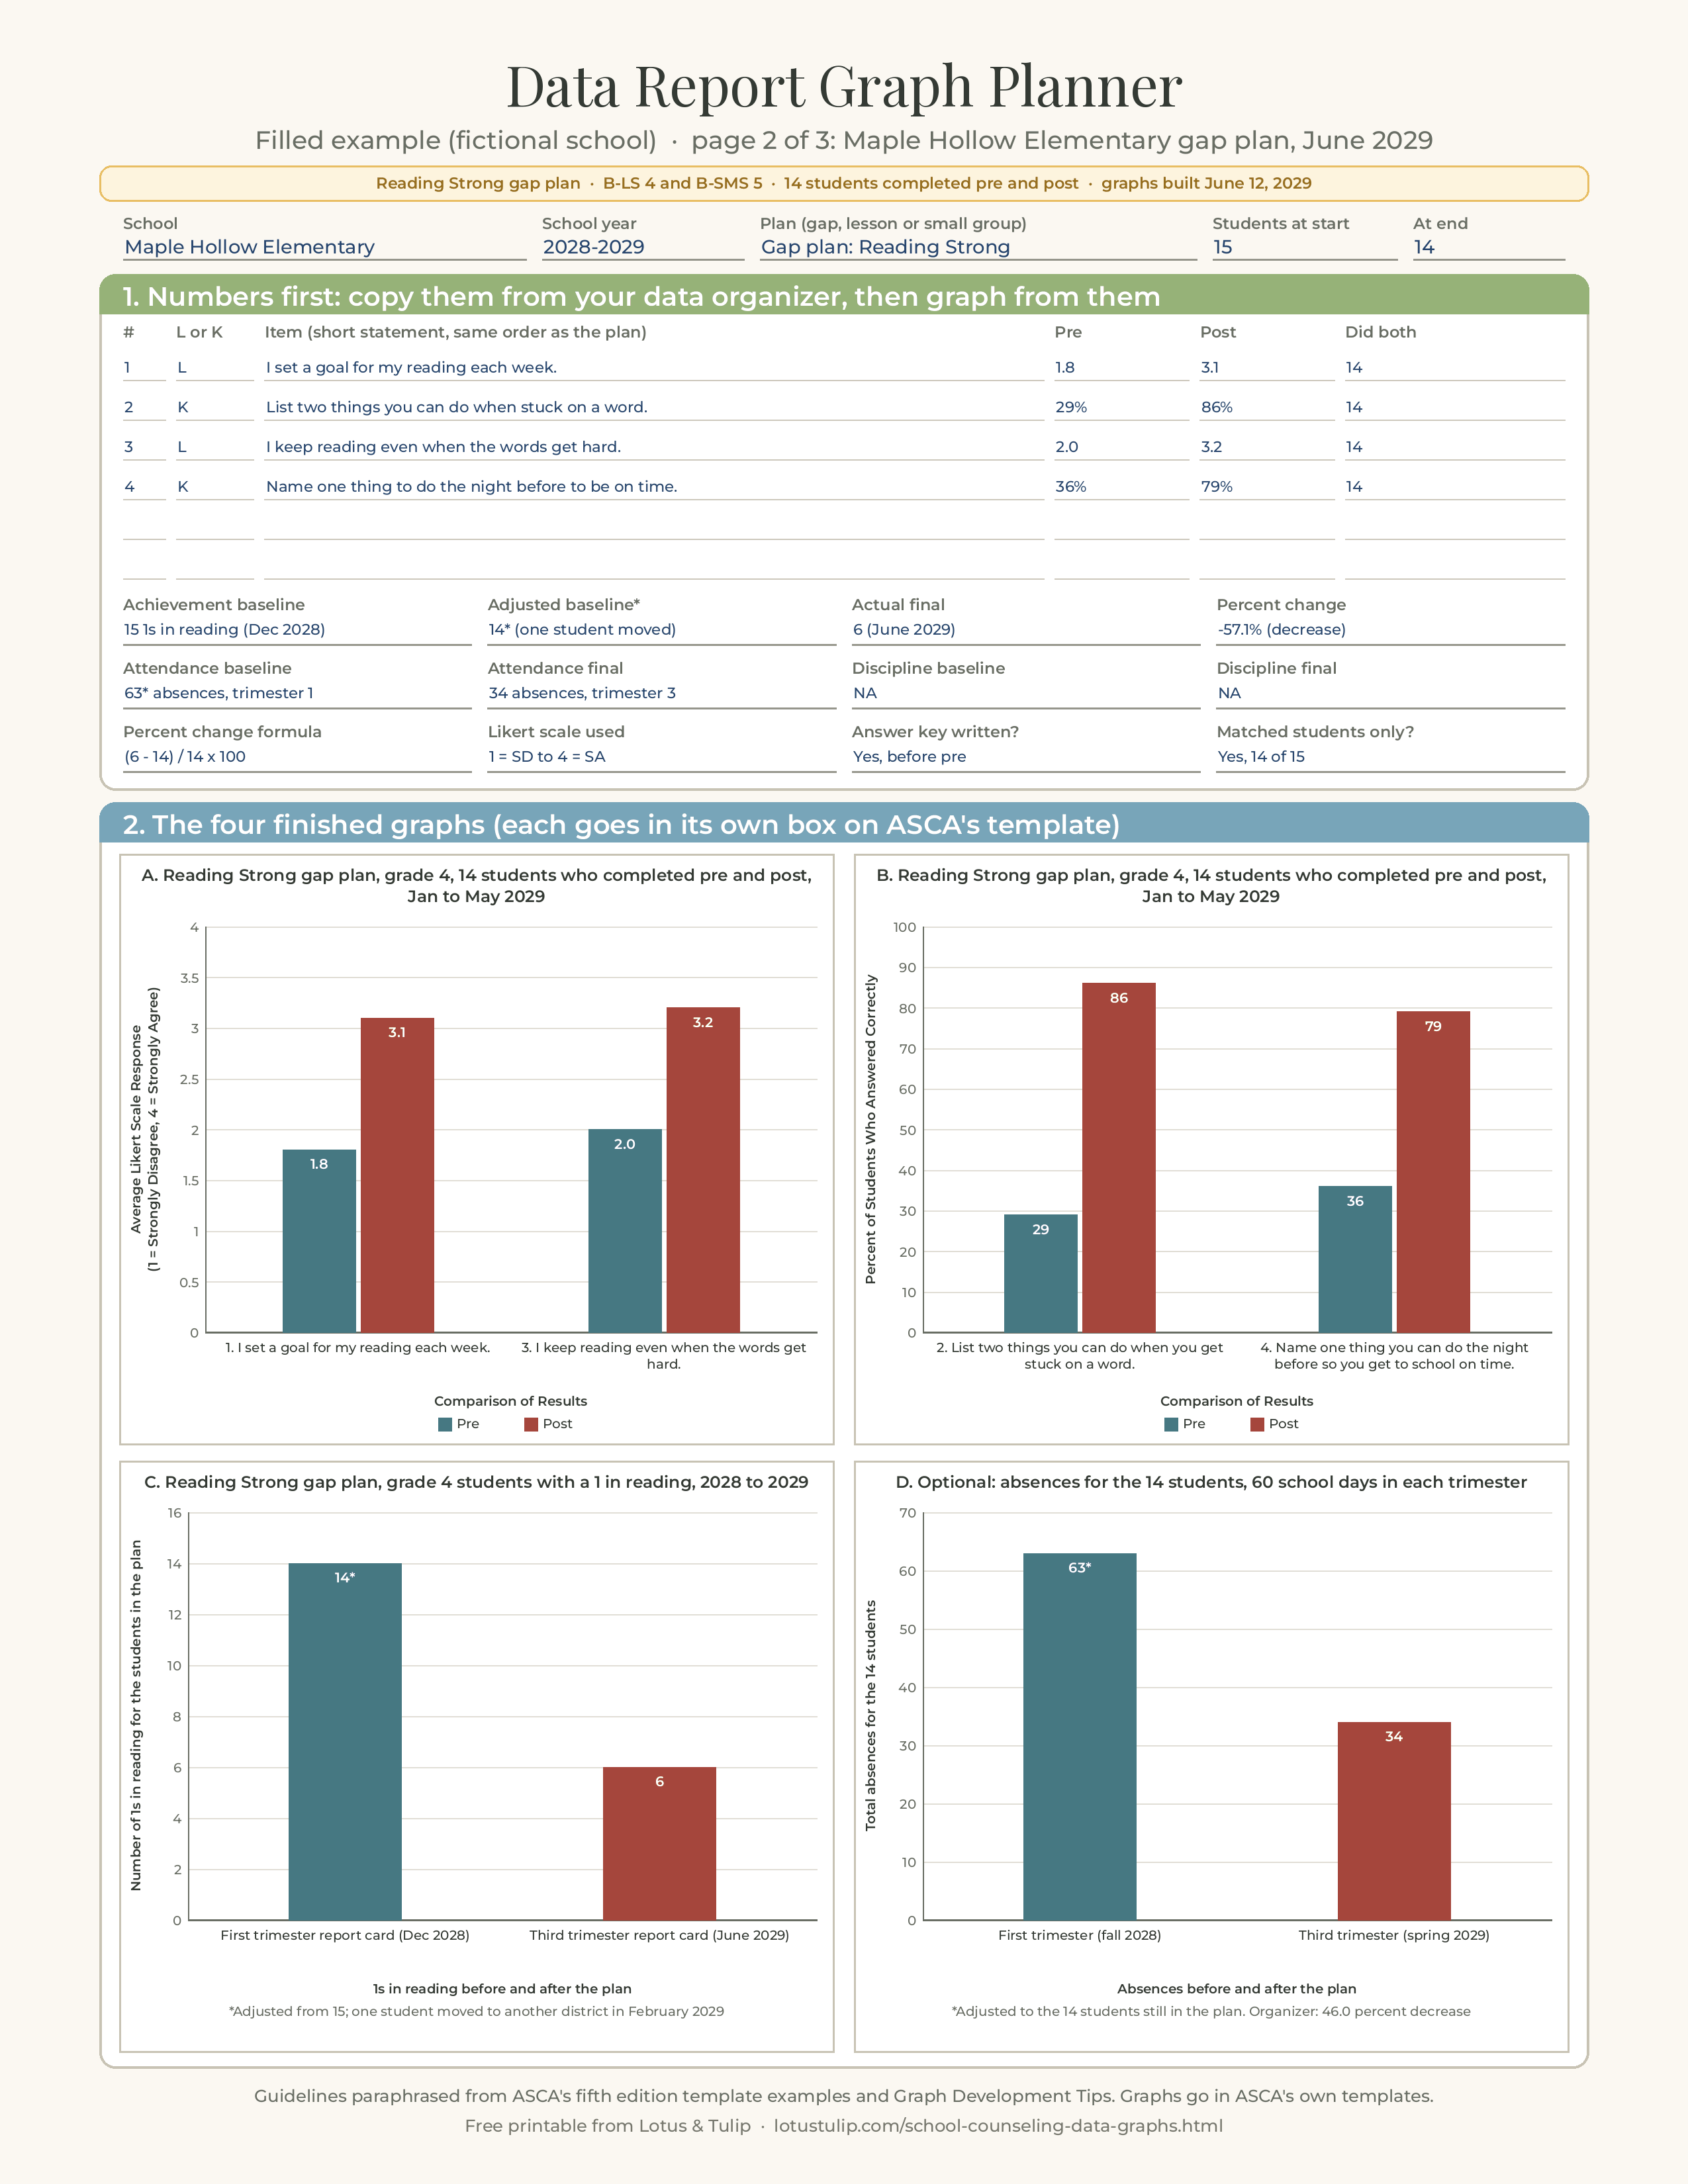
| ASCA Student Standards Data Results: Likert | Reading Strong gap plan, grade 4, 14 students who completed pre and post, Jan to May 2029 | Average Likert Scale Response (1 = Strongly Disagree, 4 = Strongly Agree), 0 to 4 | "1. I set a goal for my reading each week." and "3. I keep reading even when the words get hard."; Comparison of Results | 1.8 and 3.1; 2.0 and 3.2 |
| ASCA Student Standards Data Results: knowledge | Same subtitle | Percent of Students Who Answered Correctly, 0 to 100 | "2. List two things you can do when you get stuck on a word." and "4. Name one thing you can do the night before so you get to school on time."; Comparison of Results | 29 and 86; 36 and 79 |
| Achievement Data Results | Reading Strong gap plan, grade 4 students with a 1 in reading, 2028 to 2029 | Number of 1s in reading for the students in the plan, 0 to 16 | "First trimester report card (Dec 2028)" and "Third trimester report card (June 2029)"; 1s in reading before and after the plan | 14* and 6, with the note "*Adjusted from 15; one student moved to another district in February 2029" |
| Contributing factors: attendance | Reading Strong gap plan, absences for the 14 students, 60 school days in each trimester | Total absences for the 14 students | "First trimester (fall 2028)" and "Third trimester (spring 2029)"; Absences before and after the plan | 63* and 34, same asterisk note |
The organizer reports a 57.1 percent decrease in 1s in reading, (6 minus 14) / 14 x 100, and a 46.0 percent decrease in absences, (34 minus 63) / 63 x 100. The two trimesters both have 60 school days, so total absences compare fairly; if they had not, she would have graphed absences per student per 10 days instead. Above the graphs, the template's "Behavior Standards Addressed" list reads "1. B-LS 4. Self-motivation and self-direction for learning" and "2. B-SMS 5. Perseverance to achieve long- and short-term goals," the same two standards as the plan (2.16).
Classroom lesson: two graphs
| Graph | Subtitle | Y-axis | Categories | Bars |
|---|---|---|---|---|
| Likert | Plan It, Pack It lesson, all grade 4, 71 students who completed pre and post, Oct 2028 | Average Likert Scale Response (1 = Strongly Disagree, 4 = Strongly Agree), 0 to 4 | "1. I write down my homework in a planner before I leave school." "3. Before I go home, I check that I have everything I need for my homework." | 2.3 and 3.2; 2.1 and 3.1 |
| Knowledge | Same subtitle | Percent of Students Who Answered Correctly, 0 to 100 | "2. What is missing from this planner entry?" "4. Name two things to check before you leave school." | 38.0 and 85.9; 45.1 and 90.1 |
No achievement graph, because the lesson template has none. The subtitle carries the 71 matched students; participation (74 at the start, 71 who completed both) and the reason for the change sit in the participation boxes.
Small group: two graphs plus achievement
| Graph | Subtitle | Y-axis | Categories | Bars |
|---|---|---|---|---|
| Likert | Cool and Ready group, grade 5, 7 students who completed pre and post, Jan to Feb 2029 | Average Likert Scale Response (1 = Strongly Disagree, 4 = Strongly Agree), 0 to 4 | Items 2, 3, 6 and 7 (calm down during a test, breathing tool, helpful thought, get ready plan) | 1.9 and 3.3; 2.0 and 3.4; 2.1 and 3.0; 1.7 and 3.4 |
| Knowledge | Same subtitle | Percent of Students Who Answered Correctly, 0 to 100 | Items 1, 4 and 5 (body signs of worry, ways to study for a math test, what to do when stuck) | 28.6 and 85.7; 14.3 and 71.4; 42.9 and 100 |
| Achievement Data Results | Cool and Ready group, grade 5, 2028 to 2029 | Number of students below benchmark on the math interim, 0 to 8 | "Winter interim (Dec 2028)" and "Spring interim (Apr 2029)"; Students below benchmark before and after the group | 7* and 4, note "*Adjusted from 8; one student moved out of the district after session 3" |
The small-group organizer reports a 42.9 percent decrease, (4 minus 7) / 7 x 100. Rivera uses the full item statements under the bars on the real graphs; the tables above shorten some of them only to fit this page.
Her final check
Before exporting, she reads every bar against its organizer (all 15 item results across the three reports, three achievement pairs and one attendance pair), checks that every graph starts at zero and every bar has a label, sets every Likert axis to 0 to 4, confirms no subtitle names a teacher or a class small enough to identify students, and zooms each exported PDF to 200 percent. She also copies the four gap plan graphs into a one page summary for the fall advisory council, which keeps the same subtitles so the numbers mean the same thing in both places.
This example is illustrative. The school, the people and the numbers are invented and are not ASCA examples.
A graph checklist before you upload
- It is a bar chart, with pre and post (or baseline and final) side by side.
- Likert items and knowledge items are on separate graphs.
- Every number on the graph matches the organizer: same items, same order, same values, same decimals (2.15, 2.19).
- Every item in the plan has a result, in the organizer and on a graph (2.23, 5.10, 6.13).
- The behavior standards listed above the graph match the plan (2.16).
- Aggregate data only, no individual students (2.17, 2.20).
- A subtitle with who, how many and when; not a repeat of the primary title.
- A Y-axis label that names the measure and, for Likert, defines the scale.
- An X-axis label that says what is compared, and for achievement, when the data was collected (2.21).
- A data point on every bar, including zeros.
- Axis starts at zero; Likert axis ends at the top of the scale; percent axis ends at 100.
- Adjusted baselines carry an asterisk and a note on the graph.
- No names, initials, ID numbers or class labels that identify students.
- Readable at 100 percent in the exported PDF.
Six real world scenarios
"My lesson had only one Likert item and one knowledge item." Make two graphs, each with one pair of bars. That is exactly what ASCA's lesson plan example does. One pair of bars is a complete graph as long as the subtitle, axis labels and data points are there.
"I used a 1 to 5 scale, or a 1 to 3 face scale for kindergarten." Every fifth edition example uses 1 to 4, but we found no rule that requires it. Define your actual scale in the Y-axis label ("1 = Not like me, 3 = A lot like me"), run the axis from 0 to the top of that scale, and use the same scale on pre and post.
"Post scores went down on one item." Graph it. Check the item first: young students often rate themselves high on a vague statement before a lesson and more realistically after it. Explain in the improvement reflection and fix the item next year.
"My group started with eight and ended with five." Graph the five who completed both pre and post, put "5 students who completed pre and post" in the subtitle, explain the change in the participation boxes, and adjust the achievement baseline to the five with an asterisk. Check your group still meets your purpose; RAMP Section 6 describes groups of three to 12 students.
"I taught a unit of three lessons to 400 ninth graders." The rubric says that for a lesson from a unit, "the data report should reflect the results for the entire unit." Give the pre before the first lesson and the post after the last, graph the matched students, and say "3 lesson unit, 16 sections" in the subtitle. Large numbers are easier, not harder: a digital form and a pivot table will do the averaging.
"My achievement data is a percent, such as attendance rate or percent proficient." That is fine. Name it precisely in the Y-axis label ("Percent of the 12 students proficient on the district benchmark"), run the axis from 0 to 100, and be clear in the percent change box whether you report the change in percentage points (40 to 60 is 20 points) or the percent change (40 to 60 is a 50 percent increase). Say which.
Common mistakes
- Repeating "ASCA Student Standards Data Results" as the chart title and having no subtitle. The template already prints the primary title.
- No axis titles. Default charts have none; you must add both.
- A Likert axis label with no scale. "Average score" without "1 = Strongly Disagree, 4 = Strongly Agree" misses 2.18.
- An achievement X-axis without dates. "Before" and "After" do not say "when data was collected."
- Likert and knowledge items on one graph. The Likert bars disappear at the bottom of a 0 to 100 axis.
- Counts instead of averages or percents. "9 students agreed" is not what the organizer asks for.
- Numbers that differ from the organizer, usually by rounding (1.86 on the graph, 1.9 in the organizer) or by an item that was dropped.
- Missing data labels, especially on zero bars.
- A different achievement measure on the graph and in the organizer, the same slip as in ASCA's small-group example.
- Bars for individual students or labels that identify a student or a tiny class.
What ASCA's documents do not tell you
We looked for each of these in Graph Development Tips, the three blank templates, the three filled examples, the fifth edition RAMP rubric and the Templates and Resources page, and did not find them:
- colors, fonts, chart sizes or whether a color printout or black and white matters;
- how many decimal places to use for averages and percents, or a rounding rule;
- a required axis range (the examples all use 0 to 4 and 0 to 100, but no rule says so);
- a maximum number of items on one graph;
- a formula or rounding rule for percent change, or whether to use counts or shares;
- whether pre and post results must come from the same students;
- how to score partial answers on knowledge items;
- whether horizontal bar charts are acceptable (the guideline says only "bar charts"; every example uses vertical columns);
- labeling rules or rubric points for contributing-factors graphs (attendance and discipline graphs are optional and not mentioned in the rubric);
- whether a fifth edition Likert scale other than 1 to 4 is acceptable.
If one of these matters for your application, ask ASCA before your data year ends: the RAMP FAQs page points to RAMP office hours "to help you better understand the scoring rubric" and to a contact for general help questions. ASCA can also revise its documents at any time, so check the footer dates (Graph Development Tips currently reads "Rev. 9/25").
Free printable: data report graph planner, filled example and check sheet
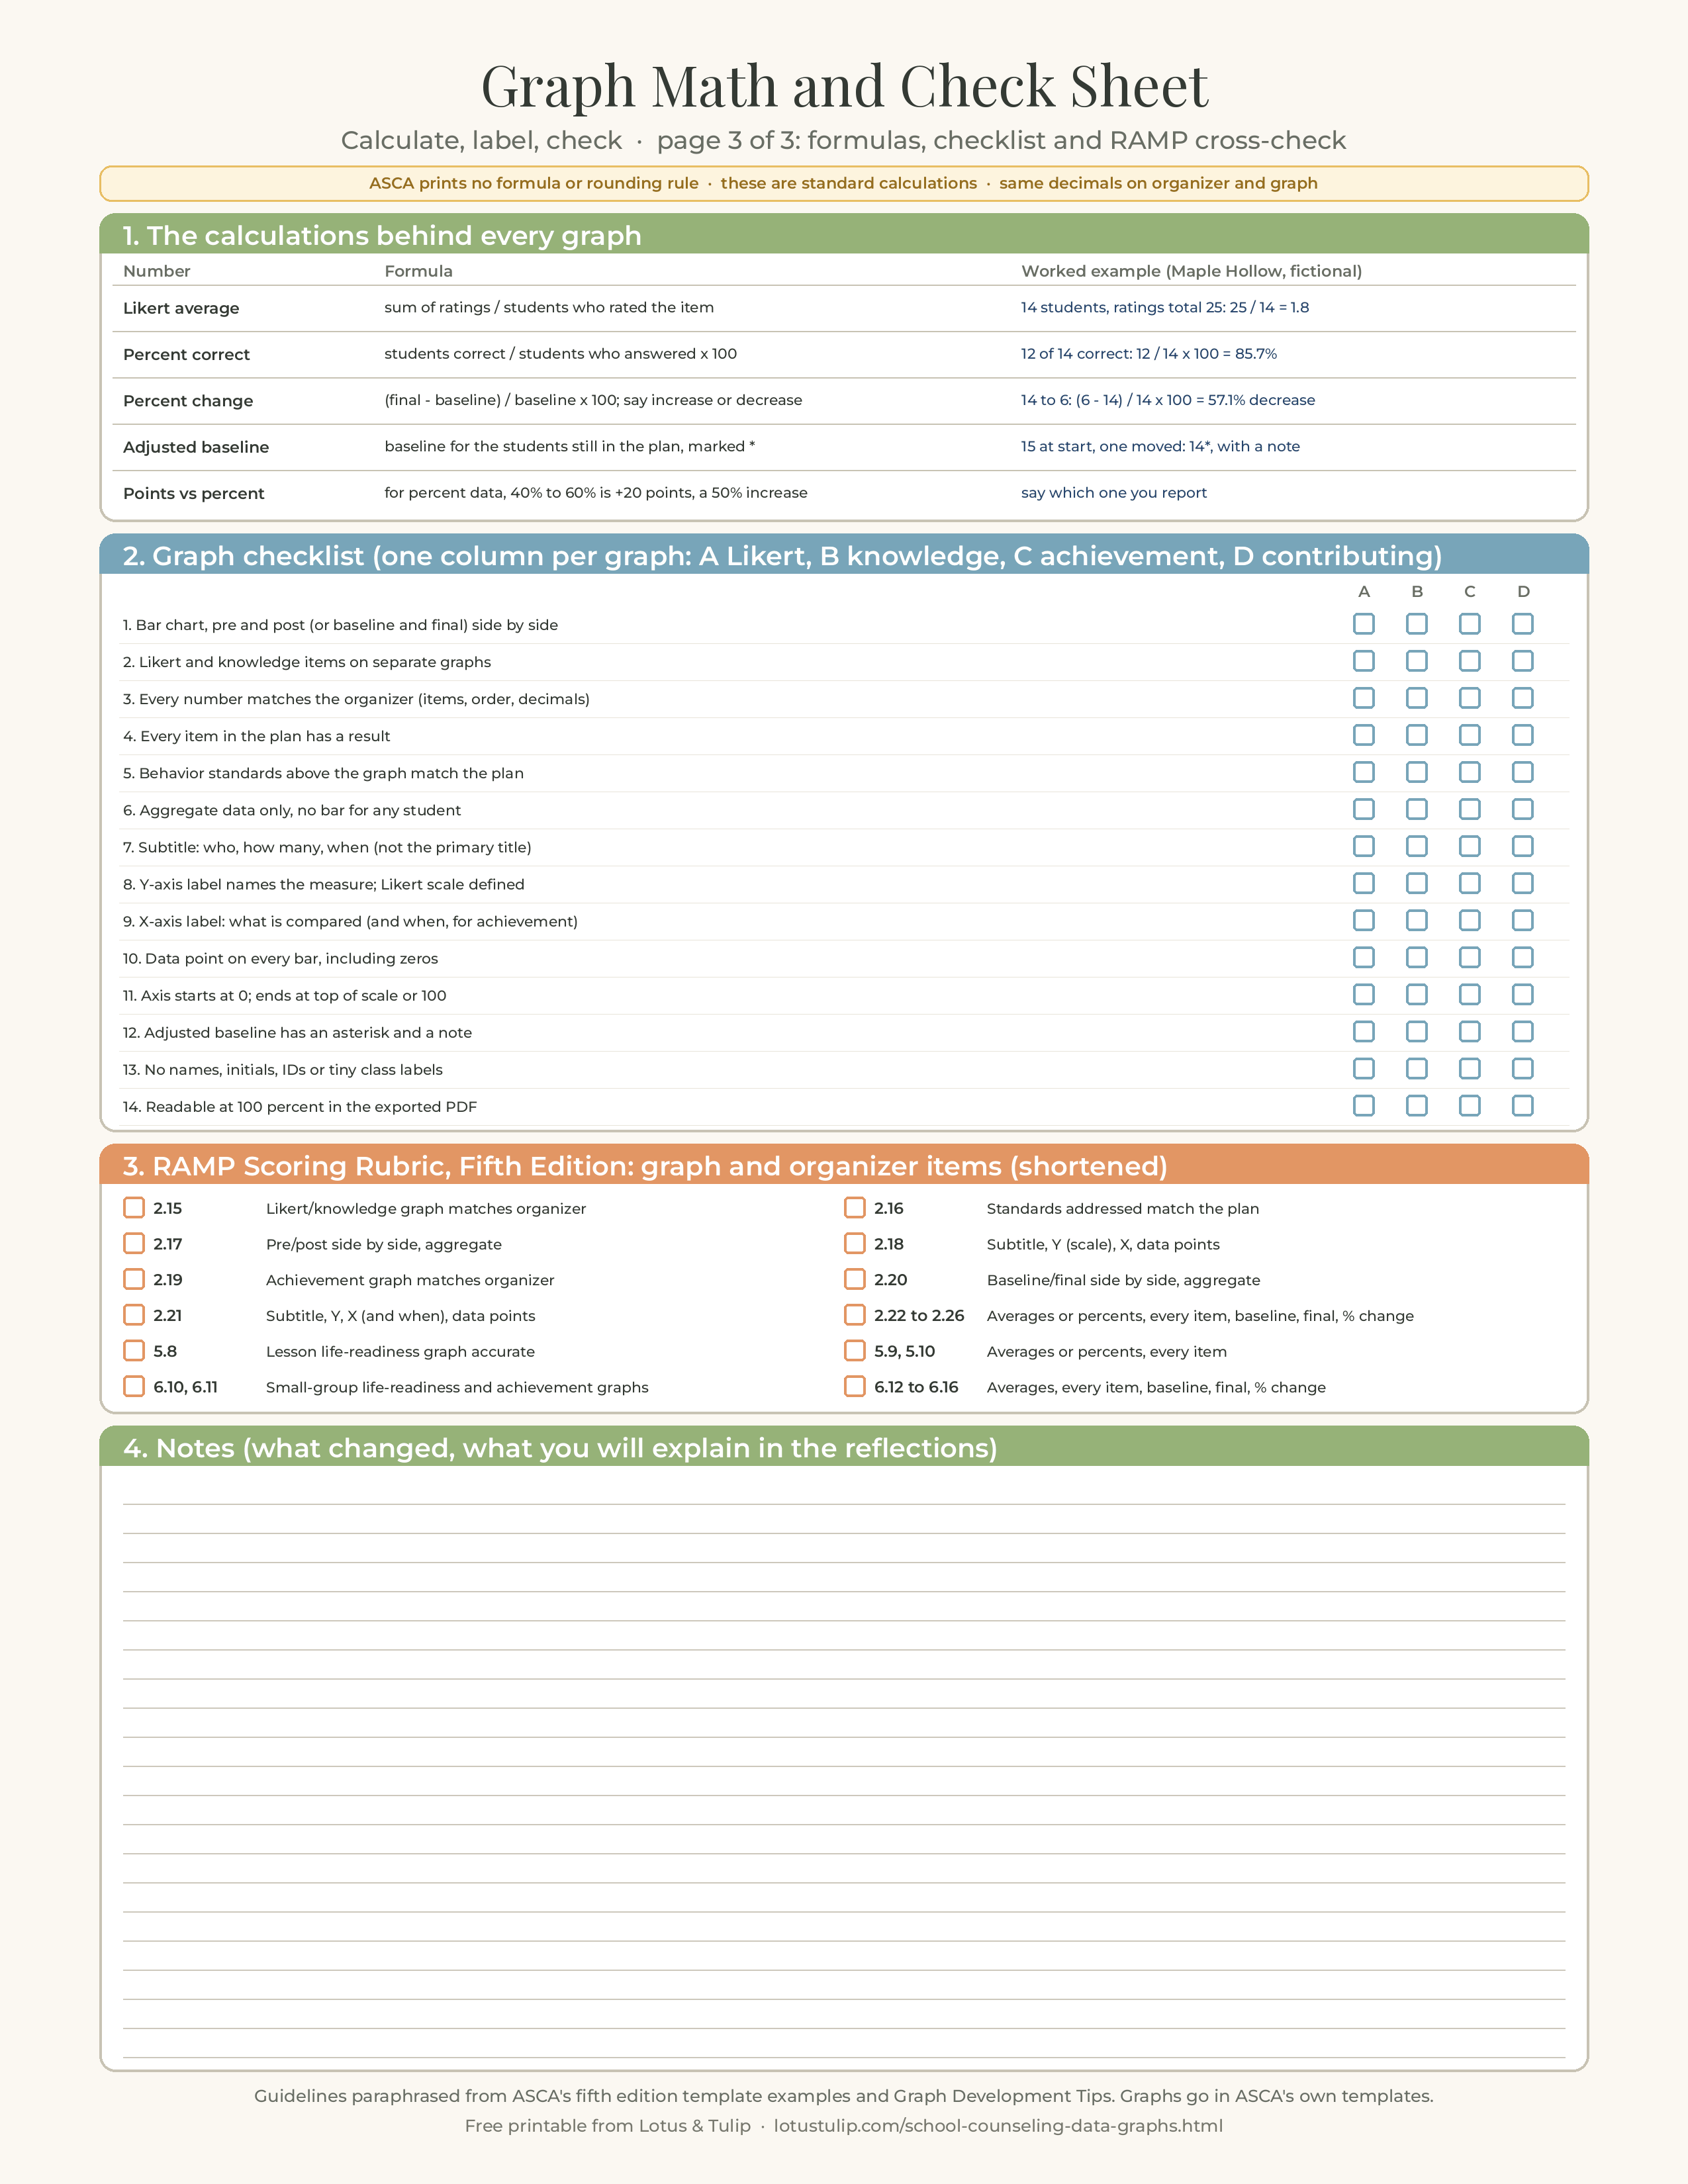
The free printable has three US Letter pages. Page 1 is a blank graph planner: the plan type and participation at the top; a numbers table for up to six pre and post items (type, short statement, pre, post, students who completed both) with achievement baseline, adjusted baseline, final and percent change, and attendance and discipline baseline and final; then a label planner for all four graphs (Likert, knowledge, academic success and contributing factors) with the primary title ASCA prints on the template and lines for your subtitle, Y-axis label, X-axis label and categories, and the axis range. Page 2 is the same planner filled in for the fictional Maple Hollow Elementary "Reading Strong" gap plan described above, with all four finished bar charts drawn the way ASCA's guidelines describe. Page 3 is a math and check sheet: the Likert average, percent correct, percent change and adjusted baseline formulas with worked examples (plus a reminder on percentage points versus percent change), a 14 point graph checklist with a box for each of four graphs, a RAMP cross-check keyed to items 2.15 to 2.26, 5.8 to 5.10 and 6.10 to 6.16, and space for notes.
The printable is a planning and checking tool. Your graphs still go into ASCA's own fifth edition templates, which the rubric says must be used in their original form.
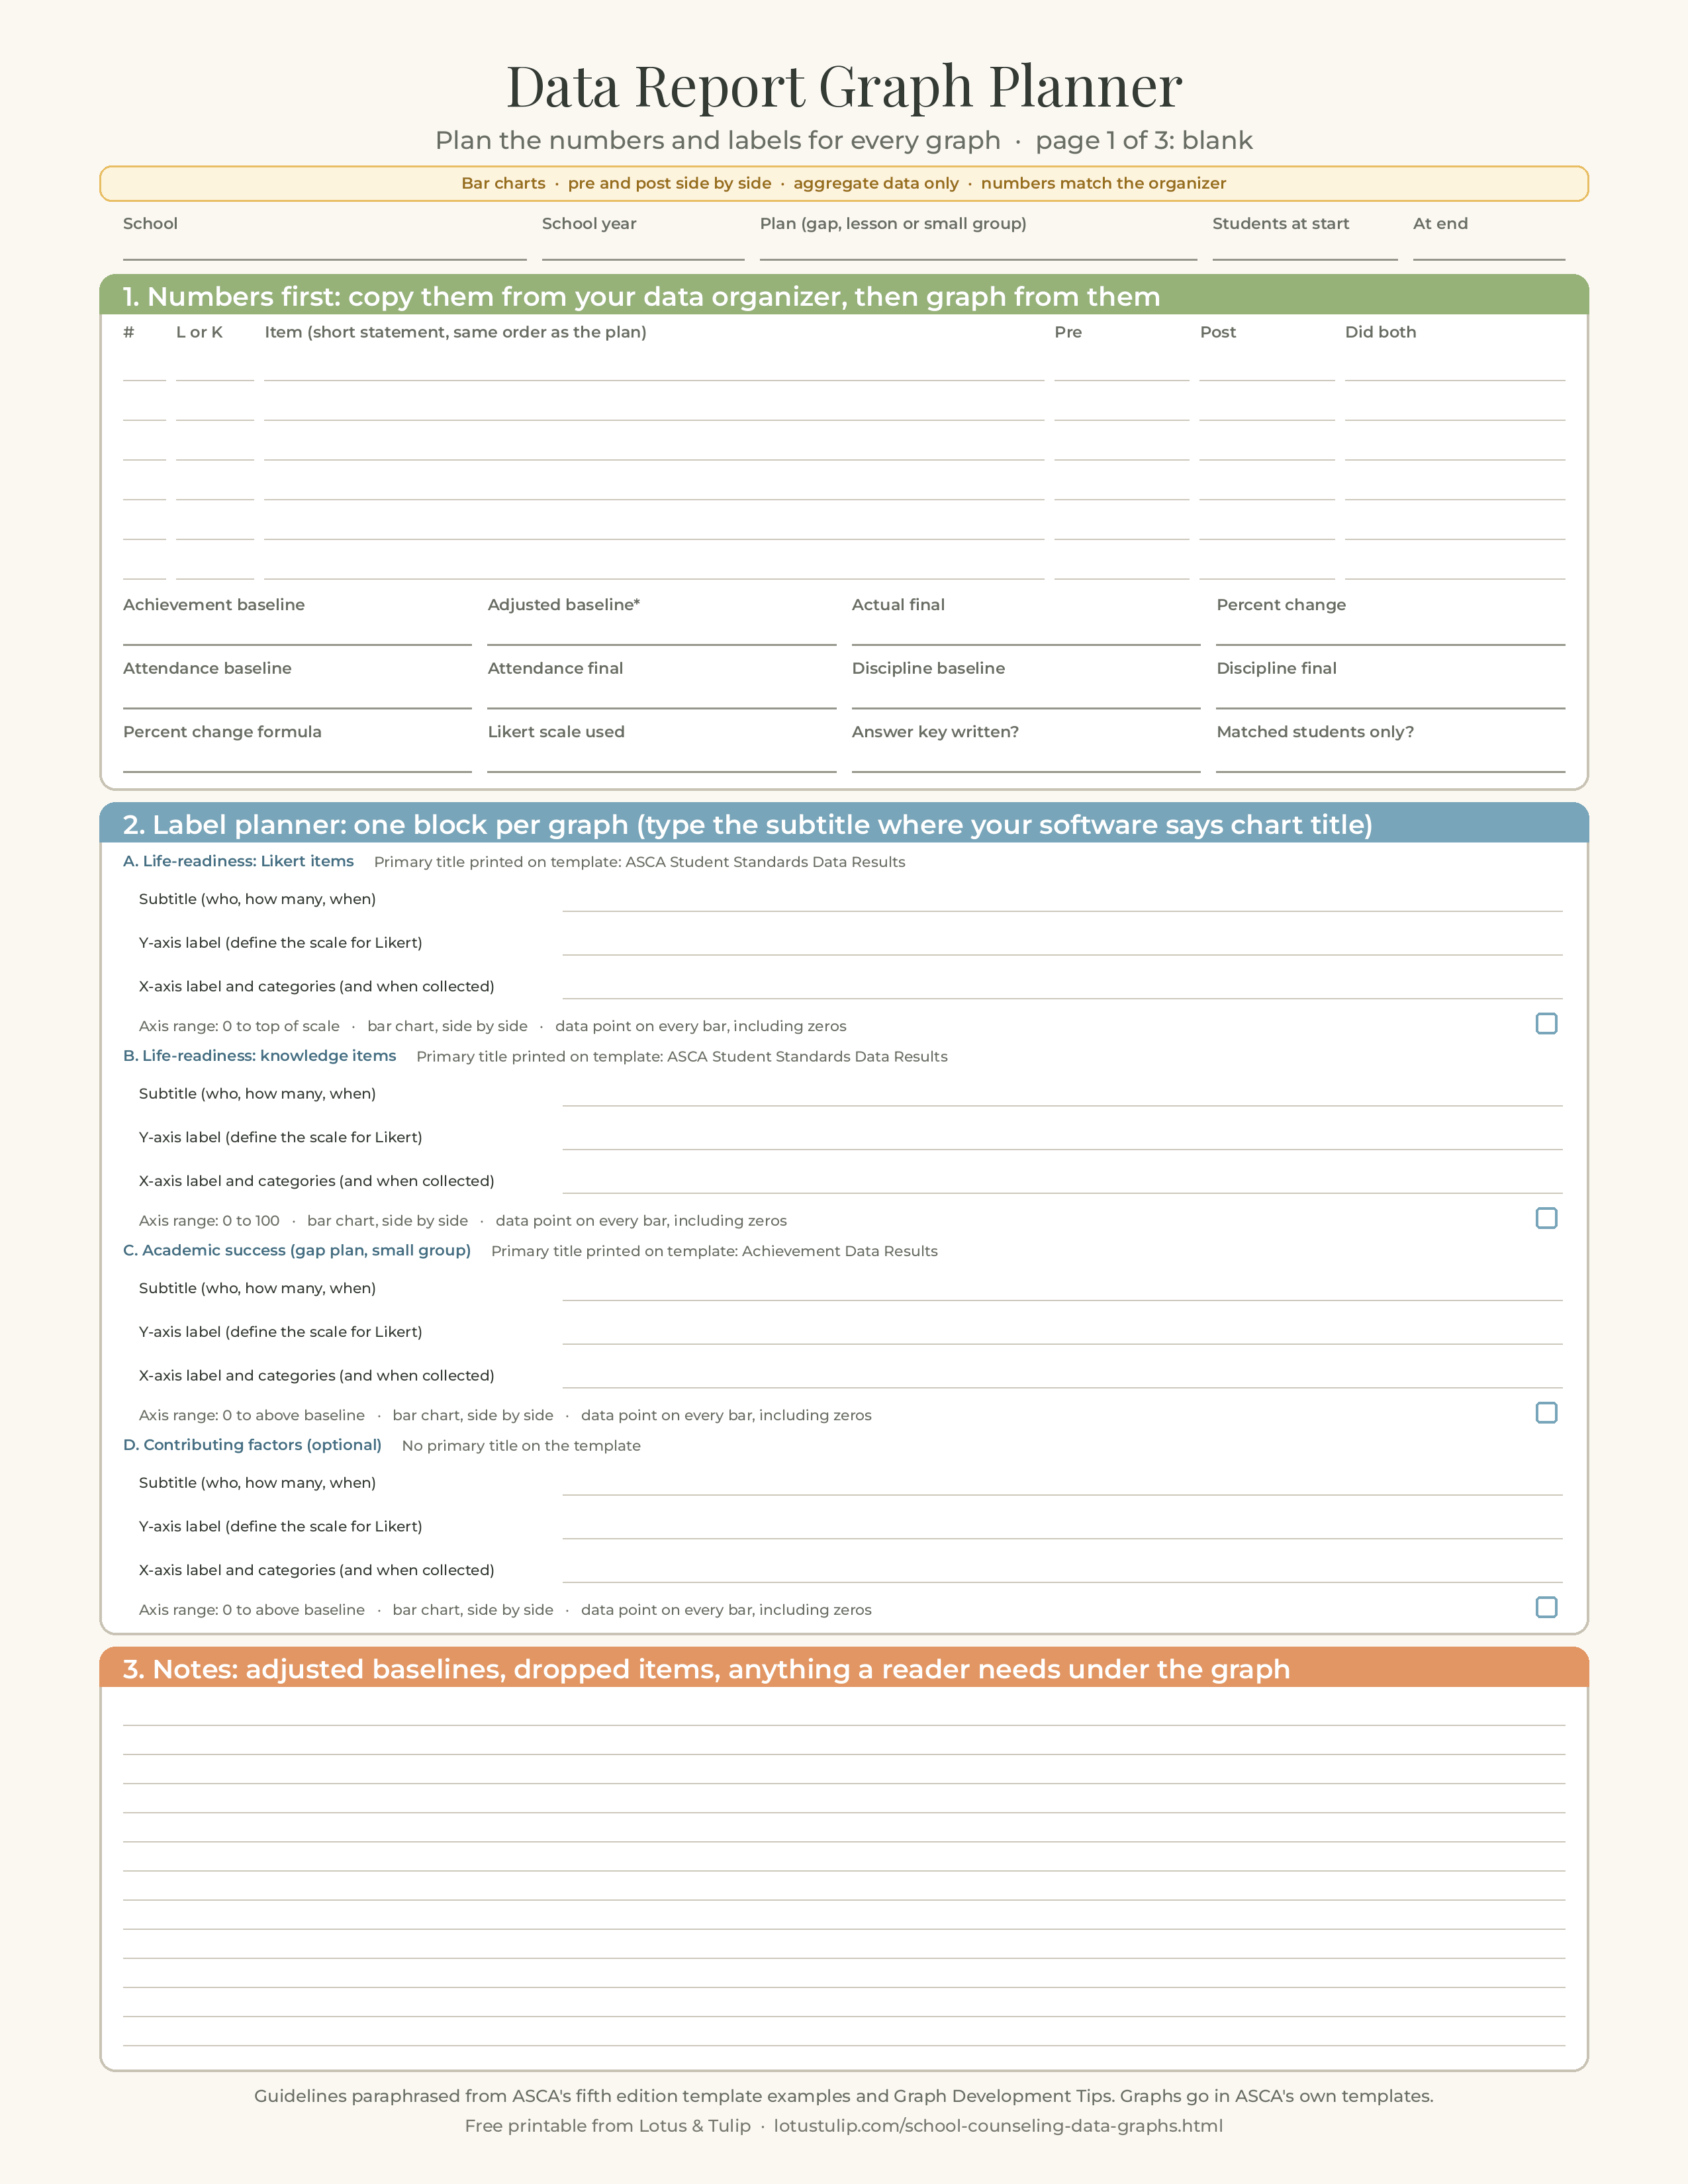
Download the free graph planner, example and check sheet (PDF, 3 pages)
Or download single pages: Page 1: blank graph planner (PNG) · Page 2: filled example with four graphs (PNG) · Page 3: math and check sheet (PNG)
Free to print and use in your own school. Please link to this page rather than re-uploading the file. This is a planning tool, not an ASCA publication, and it does not replace ASCA's templates or Graph Development Tips. Keep student names off any copy you share or upload.
Related resources
- Closing the gap action plan: the ASCA achievement gap plan and data report (RAMP Section 2)
- Classroom lesson plan: the ASCA lesson plan and data report (RAMP Section 5)
- Small-group action plan: the ASCA small-group plan and data report (RAMP Section 6)
- ASCA mindsets and behaviors pre and post survey questions: an item bank for all 36 standards
- Small group counseling pre and post assessment
- School counseling data priorities
- RAMP application checklist: every fifth edition rubric item, upload and deadline
- ASCA school counseling program assessment: all 25 benchmarks
- School counselor advisory council agenda and minutes
- All school counselor small group curriculums
Sources: American School Counselor Association, Graph Development Tips, ASCA National Model Fifth Edition (Rev. 9/25); ASCA, Templates and Resources page ("Graphs and Graphics"); ASCA, fifth edition templates download (Achievement Gap Plan, Lesson Plan and Small-Group Plan and Data Report templates); ASCA, All Fifth Edition Template Examples download (achievement gap plan, lesson plan and small-group plan examples); ASCA, RAMP Scoring Rubric, Fifth Edition; ASCA, RAMP Scoring Rubric, Fourth Edition; ASCA, Apply for RAMP and RAMP FAQs pages, schoolcounselor.org/RAMP. All checked November 11, 2026. The checklists, formulas presented as suggestions, worked example and printable are original to Lotus & Tulip and are not ASCA publications.
FAQ
What graphs do I need for an ASCA data report?
The fifth edition Achievement Gap Plan and Small-Group Plan each need a life-readiness graph of ASCA Student Standards pre and post results and an academic success graph of baseline and final achievement data, with optional contributing-factors graphs such as attendance and discipline. The Lesson Plan and Data Report needs the life-readiness graph only.
What labels does an ASCA graph need?
ASCA's guidelines say all graphs are bar charts and include a primary title (printed on the template), a subtitle with specific details about the students or data, a Y-axis label that describes the data and defines the scale for Likert items, an X-axis label that defines what is compared (and, for achievement data, when it was collected), and a data point on every bar.
Should Likert and knowledge items be on the same graph?
No. Every fifth edition ASCA example graphs them separately, a Likert graph on a 0 to 4 average scale and a knowledge graph in percent correct on 0 to 100. The fourth edition rubric said so directly: "create one graph for Likert-scale results and one graph for knowledge-based results."
What is the subtitle on an ASCA graph?
The line you type in your software's chart title box. ASCA's Graph Development Tips note that the primary title and ASCA Student Standards are already provided on the templates, so the chart's own title should give specific details about the students or data, for example "Reading Strong gap plan, grade 4, 14 students who completed pre and post, Jan to May 2029."
How do I calculate percent change for the data organizer?
ASCA does not print a formula. The standard calculation, which reproduces ASCA's examples, is (final minus baseline) divided by baseline, times 100. From 14 to 6 is (6 minus 14) / 14 x 100 = -57.1, a 57.1 percent decrease. Say whether it is an increase or a decrease.
Are attendance and discipline graphs required for RAMP?
No. The templates say to insert them "When appropriate," and the fifth edition RAMP Scoring Rubric does not mention attendance or discipline graphs in any item. The required graphs are the life-readiness graphs (2.15 to 2.18, 5.8, 6.10) and the academic success graphs (2.19 to 2.21, 6.11).